


Amazon: The GOAT STGU
GOAT: Greatest of All Time | STGU: Stock That Goes Up

Amazon Broke The Mold
I remember vividly the early days of Amazon. Your traditional value investor types moaned about “lack of profit,” “uneconomic growth,” and “valuations distorted from reality.”
What these Graham and Dodd disciples had never seen before was a company so committed to reinvesting in its growth that it purposefully forwent profit. What they were perhaps missing was the exponential growth potential of a business like Amazon. From the earliest days of Amazon, Jeff Bezos let it be known that he planned to sell everything to everyone via the internet. Some people may have overlooked that ambition.
This exponential growth objective was inherently at odds with traditional security analysis. The Graham and Dodd principles are largely based on manufacturing businesses in post-Depression and post-War America that had no conceivable ability to grow in an exponential manner. After all, it is quite hard to multiply your revenue when you run a textile factory and are constrained by the limitations of 4 walls and the factory line.
I’ll say something controversial. Ben Graham could not have conceived of a business like Amazon that with the power of the Internet could sell to everyone on the planet, could set up recurring revenue relationships with its customers, could derive high margin take rate from the sales of third party merchants and could reinvest all profits back into growth.
Alas, Amazon was the first company I can recall that really harnessed the geometric growth potential of the Internet and went after the opportunity with no hesitation. Traditional investors despised the approach simply because of its foreignness. Amazon and the Internet took the traditional rules and threw them out the window to great success. Let’s take a look.
Amazon By The Numbers
This is what Amazon looks like if you take its quarterly segment results and present them in easily digestible graphics. What you will see below are graphs of revenue and revenue growth compared with operating income and operating margin.
The Early Years (2002-2008)

I present a snapshot of AMZN results from the mid 2000’s simply as a comparison to the future. In my first post, I made a reference that Jeff Bezos would tell you how important durability of revenue growth is. Well, now is the time to drive that point home.
You’ll see that for most of its time in the mid 2000’s, AMZN grew roughly 30% per year in terms of revenue. There is some lumpiness to their results because this is mainly reflective of the North America retail business, but still the growth rate is approximately 30%. EBIT margins were flat to down over the period in the mid single digits.
Notice that despite the modest margin compression gross operating profit dollars are up handsomely. Also notice that AMZN at the time was making a mere $100-200m per quarter on $4-5 billion per quarter, admittedly not an impressive sum relative to revenue.
If you were to transport yourself back to 2008 and were to look at AMZN as an investment, you might conclude a few things. You might conclude that:
Revenue growth has reached its limit and will decelerate from here, OR
Amazon has benefited from being an early adopter of the internet and soon its competition will begin to move online and squeeze the business, OR
Amazon has already sold all of its highest margin products and will have to mix into lower margin product to make more money (i.e. things get harder from here)
These all seem like reasonable assertions for 2008 AMZN. Let’s see how things panned out.
The Later Years (2008 - Today)

Instead of decelerating growth and increasingly pressured margins, AMZN saw consistent high growth (and even periods of acceleration) all while seemingly controlling their margin profile.
Math is a hell of a thing. A largely durable growth rate of 30% per year saw AMZN’s revenue per quarter grow from $4-5 billion in 2008 to ~$80 billion in 2020.
And just imagine if someone came up to you in 2008 and said:
“Hey Dubra, in 2020 Amazon is going to have approximately $80 billion in revenue per quarter.”
You and I both would have laughed the guy out of the room.
“What are they going do to? Give stuff away?”
The backward-looking absurdity of $80 billion in revenue per quarter in 2020 is a construct of the human mind, which has a very hard time conceptualizing geometric growth.
I just went to a calculator and plugged in the numbers to see what AMZN’s $19.2 billion in revenue in 2008 would be in 2020 compounded at 30% a year. It’s $343 billion, or $85 billion per quarter. The Wall St suits say it’s going to be $347 billion this year - pretty close!
What we have seen in these last two graphics is the sheer power of unconstrained growth and durable growth rates. If you hold a company that could possibly follow this growth pattern, suppress the desire to sell it. (Note: Not investment advice)
Segment Performance
North America: Escape Velocity

Amazon’s revenue growth has been impressive for most of its time as a public company. A key ingredient in that durable growth rate has been innovation and investment in the future.
The initial growth engine at Amazon is what they call the North America segment. You can see above that Amazon under-earned (or over-invested) in NA for nearly a decade before hitting a level of adoption that created immense profits.
You can see from the graphics above that Bezos deliberately tried not to make operating profit. We see now the $100-200 million per quarter in operating profit in the mid 2000’s were a function of how much management wanted to reinvest in the business and not a function of the earnings potential of the business.
Whoops to our 2008 conclusions that AMZN margins would only be more challenged from here!
The profitability spigot got turned on sometime in 2015 and for unknown reasons. I attempted to figure out why this took place using the disclosures in 10Q & 10K filings.
From the 2015 Q3 10Q:
The increase in North America segment operating income in absolute dollars in Q3 2015 and for the nine months ended September 30, 2015, compared to the comparable prior year periods, is primarily due to increased unit sales, including sales by marketplace sellers, partially offset by increased levels of operating expenses to expand our fulfillment capacity and spending on technology infrastructure. There was a favorable impact from foreign exchange rates of $11 million and $24 million for Q3 2015 and for the nine months ended September 30, 2015.
It seems that in 2015 management simply decided that now is the time to begin producing profits. And boy did they produce some profit!
I call the phenomenon Escape Velocity. It’s when a business makes the transition to profitability after quarters and years of investment and can now fund its growth internally rather than relying on external capital. AMZN North America hit this decisively in 2015. (Aside: AMZN more than tripled over the next 18 months after hitting escape velocity)
Note: One could argue they hit escape velocity far sooner as they were internally funding a lot of growth in NA prior to this. Yes that is correct, but it looks better when EBIT just suddenly explodes higher.
Time To Go Global

I suppose this graphic gives us our answer why the North American segment began producing prodigious operating profit overnight starting in 2015. That is because management planned to go on a multi-billion investment binge in international markets starting in 2016.
This binge accelerated growth, opened up new markets and opened up a new vector of growth of Amazon and saw periods of re-acceleration in sales growth in that segment.
Some people call this the “Flywheel” of business. Well, this is what it looks like.
AWS: The Best For Last
I saved the best for last. AWS is without a doubt the best piece of the Amazon puzzle… And it is a great example of innovation creating a new growth vector!
For all intents and purposes, AWS didn’t exist in 2008 (Started in 2006, but irrelevant from an investment standpoint). When we made our 2008 predictions above, we had no idea that something incubated within the company could become such a meteoric success.
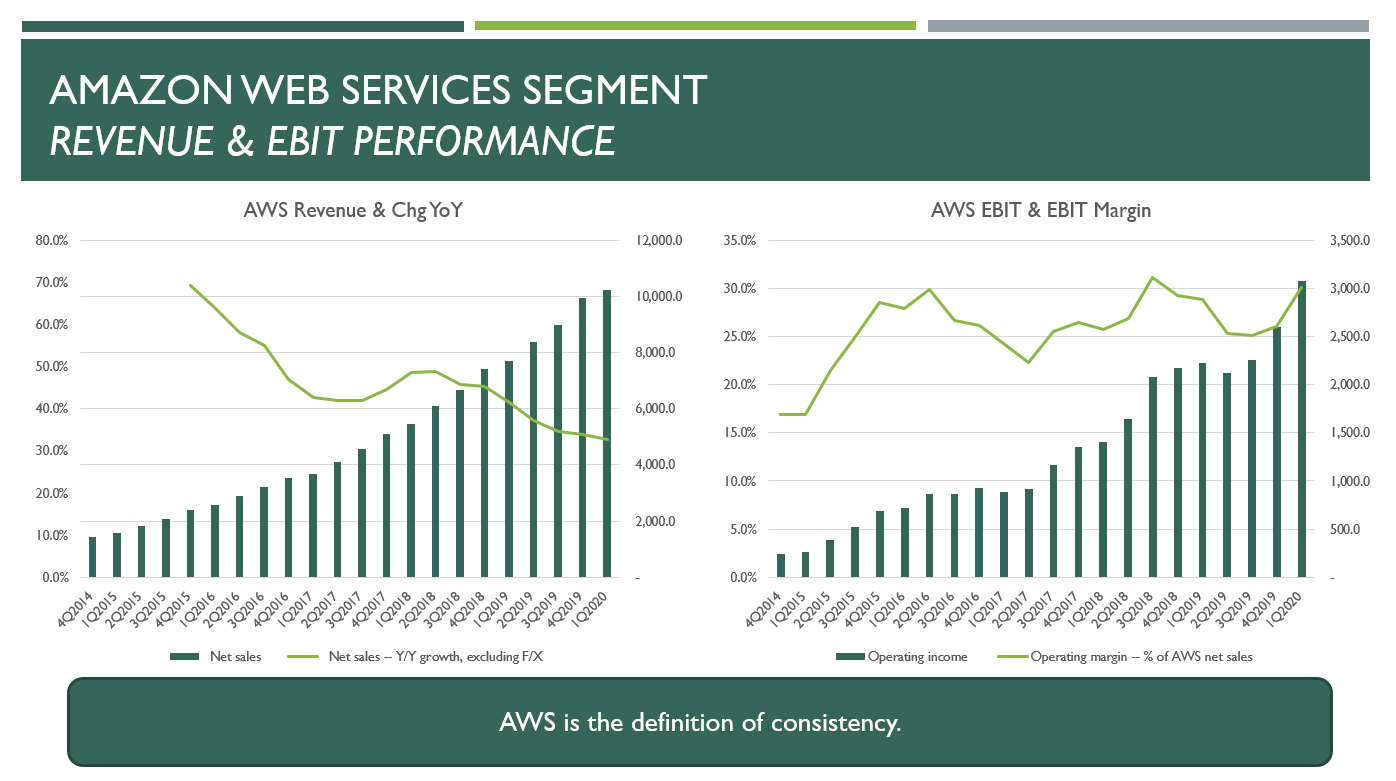
Frankly, I am not sure there is any better business in existence than AWS. Just look at the numbers. It’s a business doing almost $40 billion per year in revenue (tons of scale) and generating better than $10 billion per year in operating profit (tons of value add)… Growing at 30+% per year (ride the wave).
When you compare AWS with the NA segment or the International segment, there is no question AWS is better. NA sales can be lumpy and growth rates can accelerate and decelerate for odd reasons. AWS just grows sequentially every quarter like clockwork. Not only that, AWS margins are 6x that of the NA segment and highly consistent.
It is this type of high margin, high consistency and high durability of growth business that would have knocked Ben Graham’s socks off. He wouldn’t believe this is possible.
And guess what. Neither would we have believed it possible even as recently as 2008.
AWS is a great example of a magic innovative growth vector that can make a stock go up. AWS essentially hit escape velocity in 2014-2015 as operating profit began to scale meaningfully positive.
AMZN stock is up 580% since then. In my opinion, AWS is exactly what a STGU looks like.
Why did we just go through all of that?
We had to look at the GOAT to understand where it was, say, 10 years ago and where it is today. We had to look at the GOAT to begin conceptualizing geometric growth, what it looks like early and what it can result in.
Finally, we had to look at the GOAT to see what makes a good business (North America segment), what makes a great business (AWS) and how powerful new growth vectors can be (Intl & AWS).
Now that we have our benchmark of what seems to work for STGU, we can begin looking at new companies and comparing them to our gold standard.
I hope you enjoyed today’s post, I will see you in the next one!
-Dubra